Max Bradbury, EnergyPulse Data Manager
30/01/2026 | Offshore wind

Global offshore wind pipeline in 2025: a year in review
EnergyPulse blog - 30 January 2026
Overview
2025 was a mixed year for the global offshore wind industry. While several tenders and auctions were delayed or failed to attract bidders, activity remained resilient. A total of 40 GW of capacity was leased globally, the fourth highest year on record, while 8.8 GW reached full operations. At the end of the year, a record 33 GW was undergoing offshore construction. EnergyPulse’s Offshore Wind Costs Dashboard estimates that £53bn in CAPEX was spent in the global industry in 2025.
While RenewableUK focuses on the UK renewable energy market, EnergyPulse, its market intelligence platform, tracks and forecasts offshore wind globally, from the UK to China. EnergyPulse covers project timelines, component demand, cost estimates, project information, and supply-chain contracts.
This blog provides a high-level review of global offshore wind activity in 2025 and a near-term outlook to 2030. Given where most offshore wind activity occurred during the year, a significant portion of this review necessarily focuses on activity in China.

Figure 1: Operational and future wind farm layouts in the two global regions with highest activity: China and the North Sea. Windfarm polygons are created in a collaboration between EnergyPulse and Vekta Group’s Vekta Digital platform.
Related content
Commissioning and construction activity
In 2025, 8.8GW of offshore wind capacity across 23 projects reached full operation in six markets, the fourth highest year on record, bringing the global operational capacity to 89.2GW. China further extended its lead, commissioning 6GW during the year and now accounts for 52% of global operational capacity. This marked the fifth consecutive year in which China delivered more than half of annual global offshore wind additions. The UK commissioned 1.3GW, followed by Taiwan (935MW), Germany (253MW), South Korea (200MW), and France (25MW). France’s 25MW project was the only floating wind project commissioned in 2025. A further 2.4GW of projects had all turbines installed by year-end but had yet to reach final commissioning.
At the end of 2025, a record 33GW of capacity was undergoing full scale offshore construction across 12 countries, led by China (9.1GW), the UK (7.6GW), and the USA (5.9GW). As for floating capacity, 60MW is nearing completion in France and a 16MW floating pilot in China is installing anchors; once complete, this will host the world’s largest single floating turbine.
A further 30GW was progressing through onshore and offshore enabling works, including 18.6GW in China, 3.9GW in the UK, and 3.3GW in Poland. Around 263MW of this pipeline is floating wind, almost entirely in China across five demonstration and pre-commercial projects.
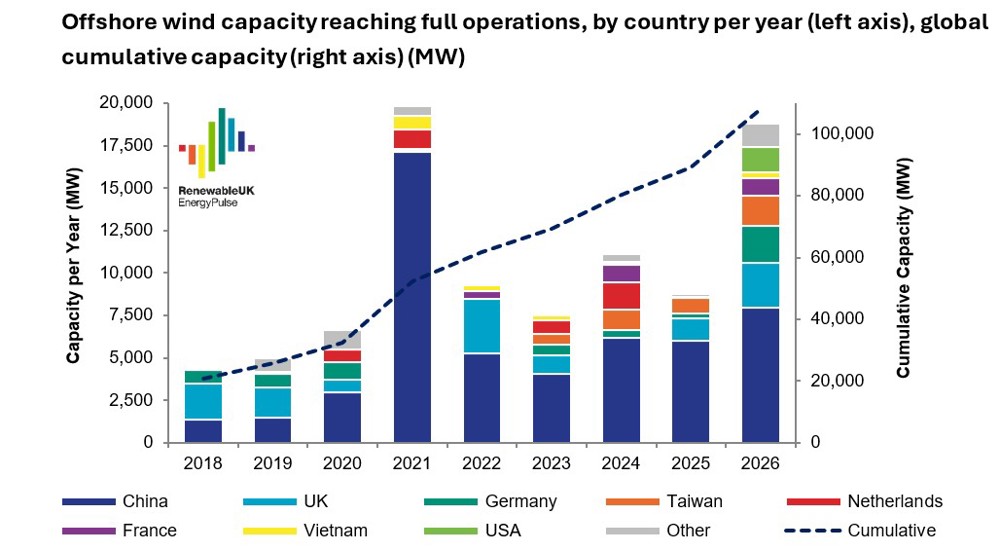
Figure 2: Offshore wind capacity reaching full operations, by country, per year (left axis), global cumulative capacity (right axis).
Seabed leasing
2025 recorded the lowest level of successful offshore wind leasing activity since 2021, as several leasing rounds failed to attract bidders due to site bankability and governments reducing leasing volumes. Despite this, 40GW of capacity received site exclusivity awards during the year, adding to the global development pipeline. Since 2021, a total of 325GW across 21 countries has been leased worldwide.
China dominated leasing activity in 2025, awarding 15.1GW across five jurisdictions in January alone, followed by a further 5GW later in the year. The UK and South Korea each awarded 4.5GW.
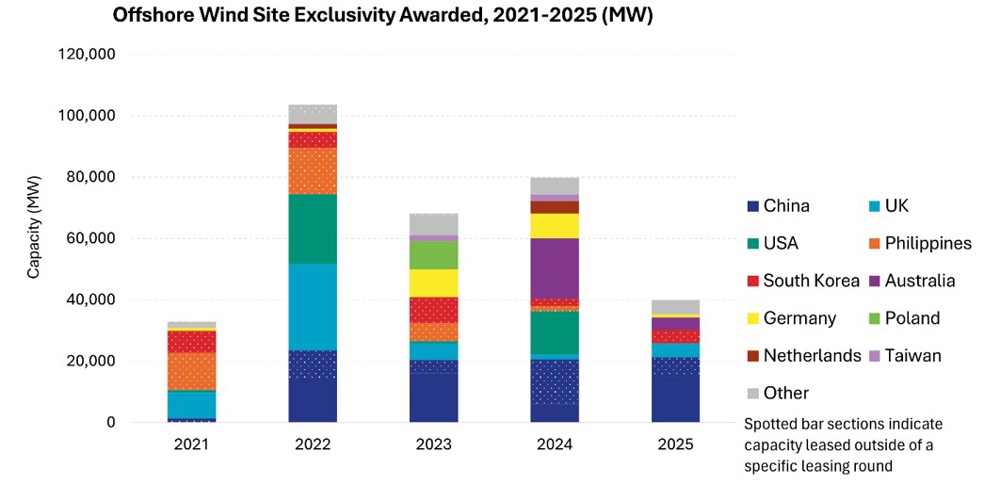
Figure 3: Global offshore wind leasing activity between 2021 and 2025. Spotted bar sections indicate capacity leased outside of a specific leasing round.
Projects reaching final investment decision (FID)
2025 was a solid year for offshore wind final investment decisions (FIDs), with 16.2GW confirmed as reaching the milestone, slightly up on 2024. This figure may be higher, as FIDs in China are not always well publicised.
Outside China, FID activity increased year on year. Capacity reaching FID rose from just under 5GW in 2024 to 7.6GW in 2025, led by Poland (3.3GW), Germany (1.6GW), and the UK (1.1GW), alongside projects in the USA (816MW), Taiwan (500MW), and Vietnam (249MW).
Turbines contracts awarded
Global offshore wind turbine awards declined in 2025, with 14.2GW awarded, down from 17.8GW in 2024. These figures include firm contract awards only, excluding preferred supplier agreements.
Chinese OEMs made up the majority of awarded capacity, securing 10.4GW, all for projects located within China. Mingyang (2.7GW) and Goldwind (2.3GW) led the year, while Siemens Gamesa and Vestas each secured around 1.9GW. Of the 3.8GW awarded outside China, projects in Germany accounted for 2GW, followed by Taiwan (1GW), South Korea (500MW), and Poland (390MW). During 2025, 2.5GW of 20MW turbines from four different Chinese OEMs were awarded firm contracts.
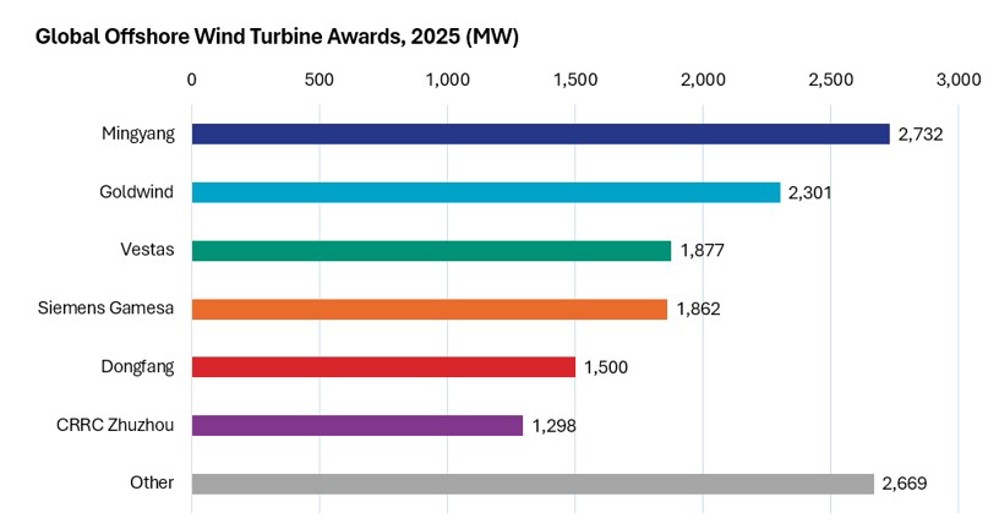
Figure 4: Firm turbine contract awards during 2025, by turbine manufacturer.
As for installation, the largest turbines installed during 2025 were 15MW models from Vestas and Siemens Gamesa in Europe. In China, installations were focused on lower wind-speed sites, favouring 8–12MW turbines paired with very large rotors (over 230 metres in diameter) to maximise energy yield. The world’s first offshore 20MW turbine was installed in January 2026, developed by Goldwind, with batch installations set to follow.
Major components installed
Global offshore wind turbine awards declined in 2025, with 14.2GW The table below summarises EnergyPulse’s estimates of the number of major offshore wind components installed in 2025, including China. Further details on manufacturers, installers, components by project, and future and past component demand forecasts are available via the EnergyPulse Dashboards.
|
Component |
Amount installed in 2025 |
|
Turbines |
1,240 |
|
Foundations |
1,941 |
|
Export Cable |
3,138 km |
|
Array Cable |
3,332 km |
|
Offshore Substations |
30 |
Looking ahead
Forecasts for 2026
EnergyPulse forecasts 18.8GW of offshore wind capacity to reach full operation globally in 2026 (10.8GW excluding China), potentially making it the second-highest year on record after 2021. This would push global commissioned capacity beyond the 100GW milestone.
2026 could also be the year that breaks a trend. Since 2021, China has accounted for over half of annual completed capacity. In 2026, larger additions from the UK, Germany, Taiwan, and newer markets may reduce China's share. Although if Chinese projects stick to published timelines, China’s proportion could be higher.
Commissioning momentum remains strong into H1 2026, with 2.4GW fully installed and awaiting final commissioning. A further four ≥1GW projects are in the final stages of turbine installation (<10% remaining).
Forecasts for 2030
By the end of 2030, EnergyPulse estimates global fully operational offshore wind capacity could reach 227GW. China is expected to contribute 124GW, followed by Northern Europe with 71GW and East Asia (excluding China) with 17GW. The remaining capacity is projected across North America, Eastern Europe, South East Asia, and Southern Europe.
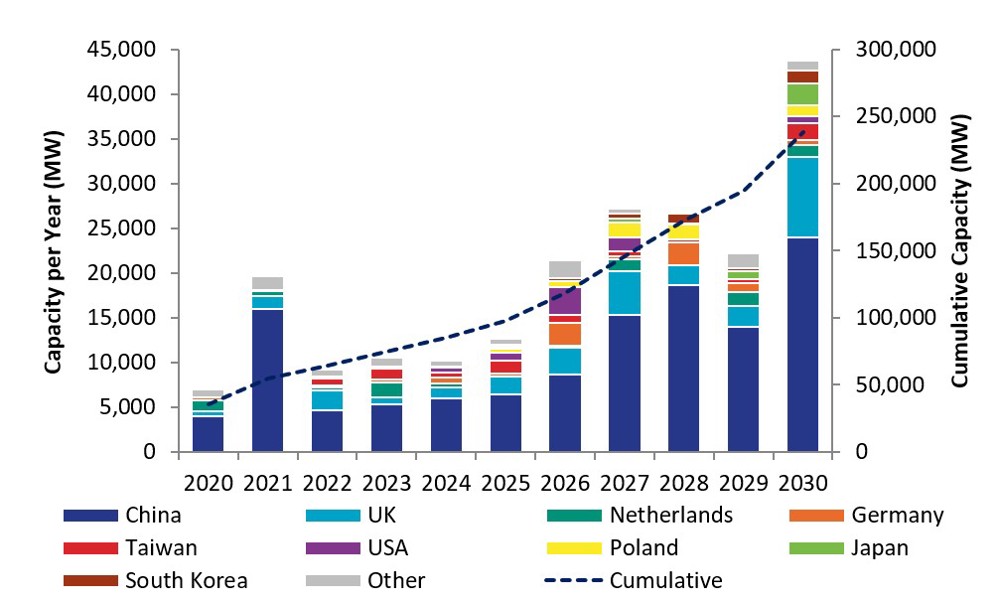
Figure 5: Forecast of global offshore wind commissioning activity, 2020-2030 (MW)
Operational floating wind is forecast to scale to 2.3GW globally by 2030, up from 277MW at the end of 2025 (294MW as of publishing), with around half of 2030 capacity located in China, followed by the UK.
To view forecasts beyond 2030, RenewableUK members and EnergyPulse subscribers can log into the EnergyPulse Dashboards.